This one is maps and clouds
What is emerging is a continuum of visualisations from static through to dynamic, and from models through to metaphors ( sounds like a target for a magic quadrant visualization ;-)
the map below is a visualisation which incorporates real information - the colours and interconnections both explain relationships which exist with the data.
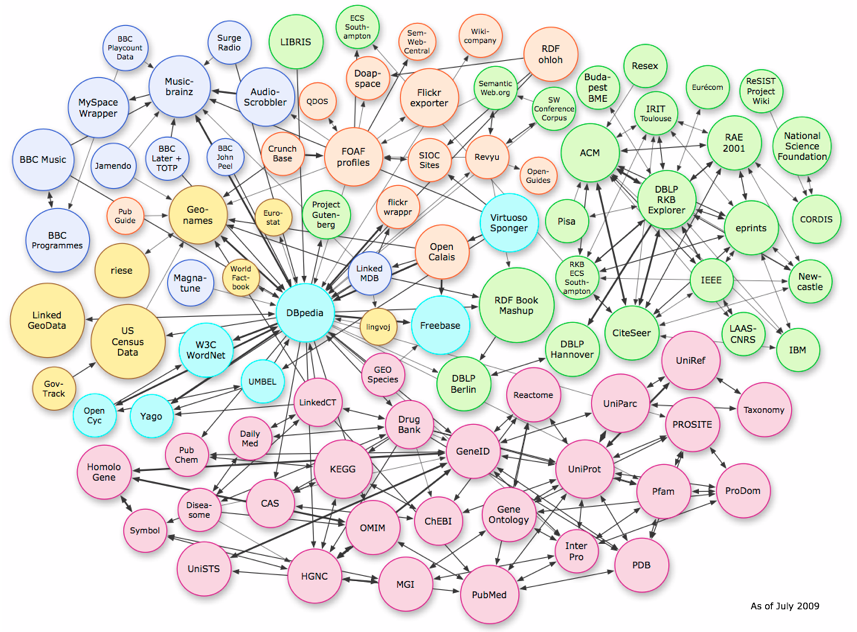
Its a map which is quite often come across - a visualisation of the Links of Data (LOD) as a cloud. The image owes its source to Christian Bizer from Berlin. The date on this diagram is July 2009. May be worth visiting the original source to check out any updates.
Also here is a further visualisation of web trends, another hybrid visualisation which is towards the model end of the spectrum.


No comments:
Post a Comment